|
Movement Analysis |

  
|
Movement Analysis
|
Movement Analysis |
|
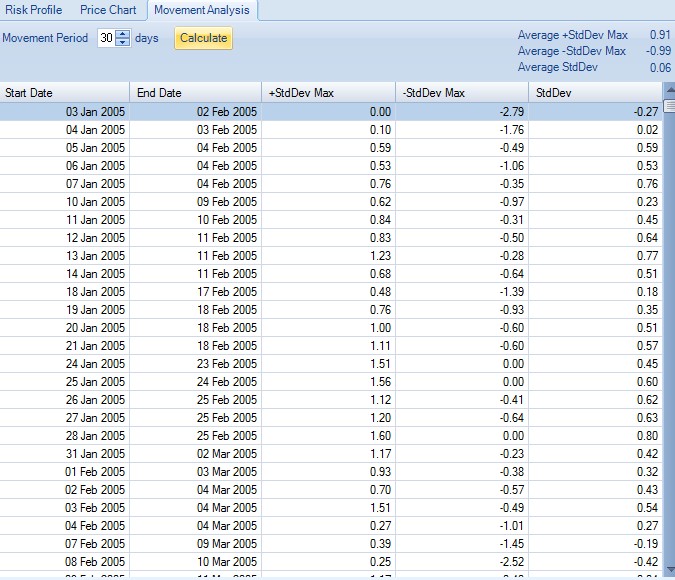
Movement Analysis provides a breakdown of how the Underlying vehicle has moved historically over a user specified period. This is measured in terms of Standard Deviations for the period, as well as maximum and minimum Standard Deviations during the period. This feature can be used to assess how well an Underlying behaves when being considered for trading a particular type of strategy. The results are also averaged which helps to show if any bias exists which it might be possible to exploit.
The following screen shot shows the Movement Analysis for an Underlying calculated for a Movement Period of 30 days. If we look at the second line detailed, for the period between 04 January 2005 and 03 February 2005, we see that the Underlying moved up a maximum of 0.10 Standard Deviations (SD) and down 1.76 SD, ending in a move of 0.02 SD on the last day of the 30 day period.